Ruth Dassonneville
Semih Çakır
Ruth Dassonneville, Semih Çakır and Philippe Mongrain
Summary
On 26 May 2019, Belgians will turn to the polls to elect members of the regional, federal and European parliaments, and the stakes are high. While the elections are still a couple of weeks away, and while many voters are believed to make up their mind in the last weeks and day before the election, research shows that election outcomes are in fact quite predictable. In this blog post, we explore two common approaches to get a sense of what the May 26 elections are likely to bring in Belgium. A structural approach that is built on insights from economic voting theory does not appear to be very fruitful to predict elections in Belgium. Our analysis of historical election data shows, in fact, no relation between economic indicators and how the government fares on Election Day. However, vote intention polls appear a very useful tool to gain insights in the likely election outcome in Belgium. An analysis of historical polling data in Belgium (since 1985) shows that vote intention polls correlate strongly with election results – even a year before the election. In addition, there are only little indications of systematic polling biases in favor or against particular parties. Given the value of polling data in Belgium, we end this blog post with a presentation of estimated trends in the polls since the 2014 elections.
Insights from structural variables
In many countries, political scientist can get a good sense of what is to expect for an upcoming election by looking at trends in some structural variables, such as the President’s job approval numbers, or the unemployment rate shortly before Election Day. The basic intuition behind this approach is that such broad indicators of ‘performance’ feed into voters’ choices, and that they will vote out of office incumbents that have low approval ratings or that oversee worsening economic conditions (for an overview of work that follows this approach, see Lewis-Beck and Stegmaier 2013).
The idea that indicators of the incumbent’s performance and macro-economic indicators influence the vote appears to hold some ring of truth, as evident from the fact that such factors have been used successfully to predict election outcomes in countries as the United States, the United Kingdom, Canada, and the Netherlands, amongst others. These efforts all suggest that when citizens approve of the incumbent’s job, when the incumbent is popular, and when economic conditions are good, the incumbent (the party of the President, the Prime Minister, or the parties that are in a governing coalition) gains more votes than when that is not the case. Such a pattern makes a lot of sense, as it fits with the theory of voters rewarding and punishing parties for their performance in office (Lewis-Beck and Paldam 2000).
The importance of such structural factors is also acknowledged by those who mainly rely on polls to forecast election results. The ‘polls-plus’ model that the FiveThirtyEight team used to forecast the 2016 US Presidential elections, for example, included an economic index.
However, does it make sense to pursue such an approach to predict elections in Belgium as well? At first sight, Belgium seems a very hard case for this type of approach to forecasting election outcomes: it has a tradition of coalition governments, which can be thought to render the attribution of responsibility for policy-making rather difficult to voters. Furthermore, the fact that the Belgian party system is de facto split along linguistic lines implies that part of the electorate can – by default – not vote for the party of the Prime Minister. Under such conditions, is there evidence of a reward-and-punishment mechanism?
To investigate this question, we compiled a dataset that includes historical electoral results and macro-economic indicators in Belgium since 1981 (when all parties had split along linguistic lines). In line with previous work on economic voting, the economic indicator is measured with some lead time before the election. More precisely, we use the GDP growth from the second quarter before the election.
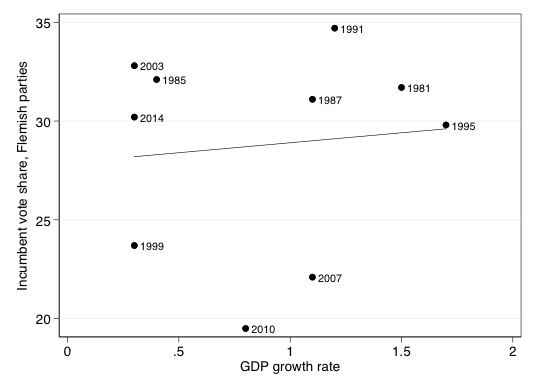
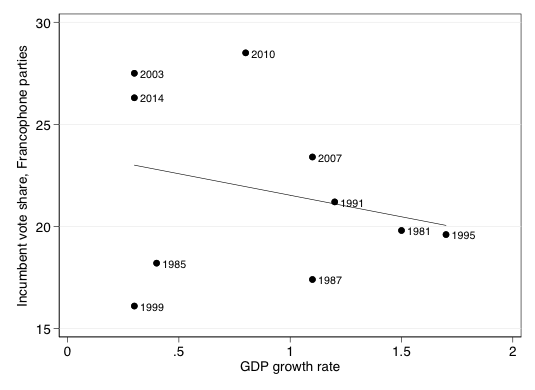
Figure 1 shows bivariate plots, in which we present the correlation between the vote share that the incumbent parties (in each linguistic group) obtained on Election Day and GDP growth (Flemish parties to the left, Francophone parties to the right). If the economic voting theory holds, the expectation would be that under stronger GDP growth, the incumbent parties gain a larger part of the vote. Clearly, there is little evidence of incumbents being rewarded for prosperous economic conditions. The correlation is close to zero for Flemish parties, and (unexpectedly) negative for Francophone parties.
We have conducted further analyses to account for the heterogeneity in the dataset – with coalition governments of different size and different composition – but doing so does not change our basic finding that the economy does not appear to be correlated in expected ways with the incumbent vote share. We have also looked at other economic indicators, such as unemployment and inflation rates (with a three-month lag), and similarly found no evidence of a pattern that is consistent with economic voting theory.
In summary, when analyzing historical election data from Belgium, we do not find evidence of a pattern of economic voting. In contrast to what holds in other countries, incumbent parties in Belgium do not appear to benefit from strong economic growth or from low unemployment rates. This is perhaps not surprising, given the tradition of coalition governments in Belgium, the presence of governments at the federal and the regional levels (that are not necessarily composed of the same parties), and the fact that parties in the other linguistic group are not on the ballot for most voters.
Insights from vote intention polls
Even though economic indicators do not seem to be correlated significantly with electoral results in Belgium, the elections are not necessarily unpredictable. Work that analyzes data from vote intention surveys shows that citizens’ preferences are structured well before Election Day, in particular in parliamentary systems (Jennings and Wlezien 2016). Recent vote intention polls should therefore give us a good indication of how the parties will do on May 26.
Before taking a closer look at recent polling data, however, we analyze how useful polling data in Belgium are historically for making predictions about the vote shares that parties will obtain on Election Day. To do so, we make use of a dataset of 233 individual polls since 1984. Our focus is on polls from the two main regions: Flanders and Wallonia.
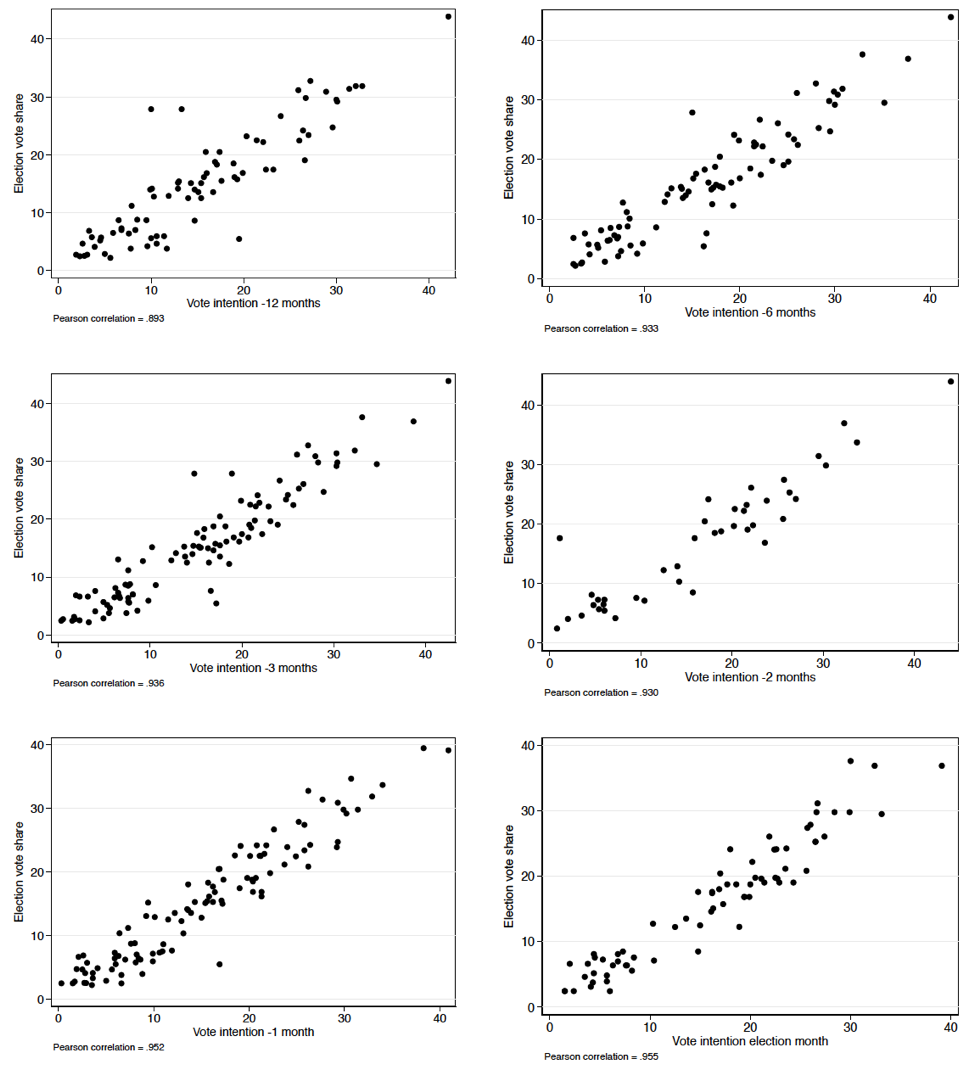
Our analyses of these historical polling data suggest that vote intention polls in Belgium closely resemble the vote shares that parties obtain on Election Day. Furthermore, this holds even when considering polls that were in the field several months before the election. Figure 2 shows the bivariate correlation between vote intention polls and electoral results, at different points in time. Even one year out, the share of vote intentions for parties correlate at almost .90 with the vote shares that parties will obtain on Election Day. Over time, as the election approaches, this correlation is further strengthened, and it reaches a level of .96 in the month before the election.
The correlations that are presented in Figure 2 seem strong, but what do they actually mean? To get a better sense of the accuracy of vote intention polls, we present in Table 3 the average absolute difference, in percentage points, between a poll result and the electoral result of a party. As we did in Figure 2, we conduct this analysis for polls that were in the field at different points in time.
As can be read from Table 3, the average absolute difference between a poll result and the vote share a party receives on Election Day is consistently under 3 percentage points – the common level of uncertainty in vote intention polls. Further, the average difference between a poll result and the election result of a party gradually declines over time – which is a logical consequence of the fact that as Election Day approaches and during the campaign, citizens make up their mind, implying their vote intention corresponds their eventual vote choice more closely.
Table 1. Average absolute difference between poll and electoral result
| Lead time | Average absolute difference |
| -12 months | 2.94 |
| -6 months | 2.58 |
| -3 months | 2.46 |
| -2 months | 2.51 |
| -1 month | 2.30 |
| Election month | 2.22 |
These results are quite encouraging, and suggest that vote intentions tend to be quite stable, and therefore reflect election outcomes relatively well. However, does this hold for all parties? Or are some parties systematically under- or overestimated in vote intention polls compared to how they do on Election Day? Work in other countries has shown that conservative parties are sometimes underestimated by the polls, while left-wing parties are at times overestimated (Durand et al. 2001; Mellon and Prosser 2017). Do we observe such a pattern for the Belgian parties as well?
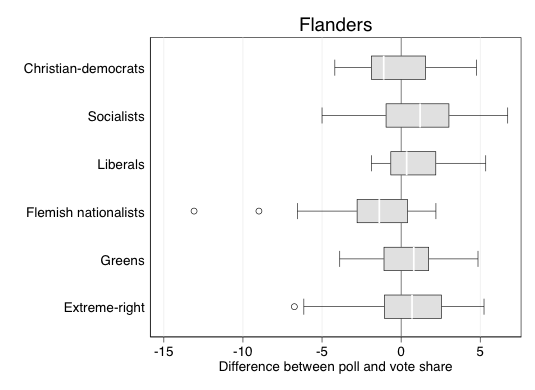
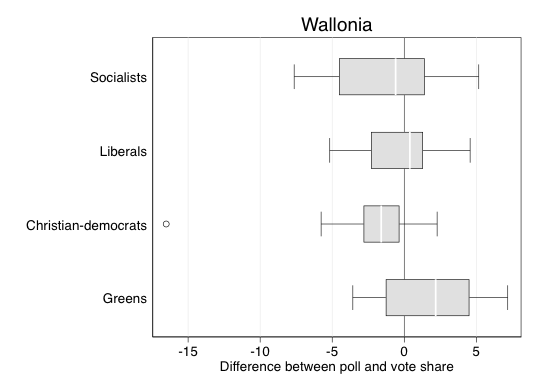
To shed light on this question, we plot in Figure 3 the distribution of the difference between the polls and the election results, by party, in each of the two language groups. Negative values signify that a poll underestimated a party, while positive values signify a party was overestimated. Given that polls that are in the field closer to Election Day are slightly more accurate, we restrict the analysis to polls conducted up to three months before the election. We also restrict the analyses to the main parties, for which we have sufficient data points to discern meaningful patterns.[1]
We present the distribution of these differences in the form of box and whisker plots. The center vertical white line in each box represents the median value, while the left and right edges of the box indicate the first and third quartiles of the distribution. The boundaries of the horizontal black line indicate where the minimum and maximum value, excluding outliers is situated. In case there are extreme outliers in the data, those are marked by the hollow circles.
Looking at these descriptive results for the Flemish parties first, we see that none of the parties is systematically under- or overestimated by the polls. However, the place of the median value for the socialists and the greens suggests that – in line with what research in other countries shows – the vote shares of left-wing parties are overestimated more than they are underestimated. In contrast to what work in other contexts suggests, the extreme-right Vlaams Belang (previously Vlaams Blok) does not suffer from an underestimation by the polls. In fact, the party’s vote share is overestimated more often than it is underestimated (median value to the right of the zero line). Interestingly, of all the parties on the Flemish sides, it is the Flemish Nationalist N-VA (previously Volksunie) that is underestimated most.
Turning to the Francophone parties
next, there are no indications of a consistent bias of the polls in favor of
left-wing parties. While the Green party is overestimated more often than it is
underestimated, the reverse holds for the Francophone socialists. Further,
while comparative research suggests that conservative parties tend to be
underestimated, this does not hold for the francophone liberals, though the
Christian-democrats are indeed underestimated more often than they are
overestimated.
Our historical analysis of polling data for the two main regions of Belgium suggests that polls generally quite closely match election results. As a result, a look at recent vote intention polls should give us a good idea of what to expect on May 26. We focus on polls published since the 2014 elections, which includes the polls that are part of the La Libre Belgique political barometer series, as well as other polls retrieved from ‘poll of polls’.
Single polls suffer from important limitations, they tend to have small samples, are not very precise, and might suffer from biases that are related to methodological choices of the polling house (Jackman 2005). In line with others, we follow aggregate individual polls in an effort to address such problems (Jackman 2005; Jackson 2016). In addition, the aggregation of different polls, that were published at different points in time, allows moving beyond the state of public opinion at one point in time and getting a sense of the trends in citizens’ vote intentions (Jackman 2005). To get a more general sense of trends in citizens’ vote intentions, we take a graphical approach and present the estimates from a local mean smoother line[2] (and 95% confidence intervals).
Figure 4 presents the results of
this analysis for the Flemish region. In terms of the trends since the 2014
elections, the graph shows fairly stable popularity for CD&V and Open VLD.
On the left-side of the spectrum, the popularity of the SP.a in the polls has
been decreasing, while both Groen and PVDA have gained popularity since 2014. Finally, the popularity of the
N-VA and Vlaams Belang has been most volatile, and the trends for both parties
seem to mirror each other. When Vlaams Belang gains popularity, N-VA
appears to lose and vice versa.
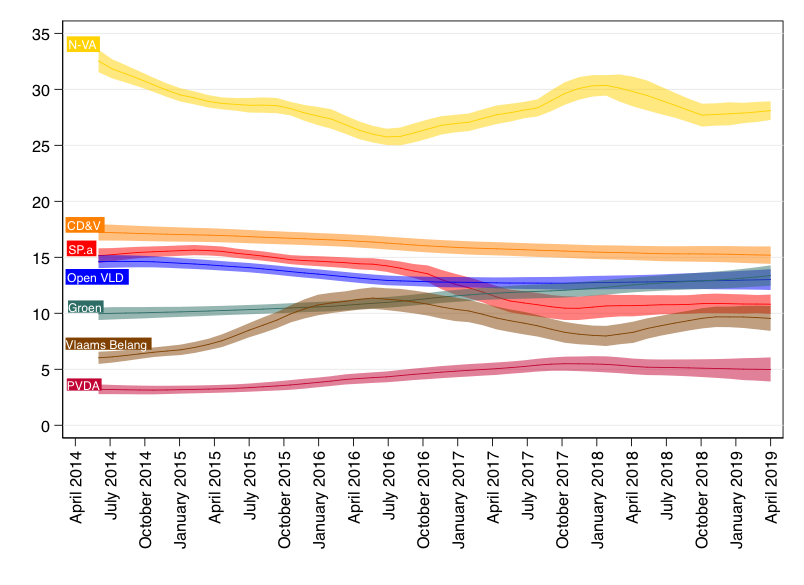
The right side of Figure 4 shows the state of the vote intention polls, at a month before the election. These estimates are summarized in Table 2. The lead of the N-VA, that polls around 28 per cent of the vote, remains very large, while the CD&V is still the second party on the Flemish sides. The polled vote intentions of Open VLD and Groen cannot be distinguished statistically, with both parties polling around 13 per cent. The same holds for SP.a and Vlaams Belang, whose popularity one month before the election is estimated to be at around 10 per cent. Finally, while the PVDA has gained popularity over time, its estimated popularity in the polls still hovers around the 5 per cent electoral threshold.
Table 2. Estimated vote intentions in Flanders, 1 month before the May 26 election
| Party | Estimate | 95% CI |
| N-VA | 28.1 | (27.3 ; 28.9) |
| CD&V | 15.2 | (14.4 ; 16.0) |
| Groen | 13.4 | (12.5 ; 14.3) |
| Open VLD | 13.0 | (12.1 ; 13.9) |
| SP.a | 10.8 | (10.0 ; 11.7) |
| Vlaams Belang | 9.5 | (8.4 ; 10.7) |
| PVDA | 5.0 | (3.9 ; 6.1) |
Turning to the state of the polls in Wallonia, we see considerably more fluctuations since 2014 than what holds for the Flemish region. The PS had lost a considerable amount of their vote in Wallonia, but seems to have somewhat recovered since mid-2017. This recovery parallels the decline of the PTB, that polled around 18 per cent of the vote in the spring of 2017 but is now polling below 15 per cent again. The MR and cdH have also lost popularity over time. The only party that has consistently gained in popularity since 2014 is Ecolo. It should be noted that we excluded smaller parties (such as Défi and PP) from the analyses, because of data limitations.
In 2017, it seemed that three parties – PS, MR and PTB – could end first in Wallonia. However, at about one month before the May 26 elections, the PS is the clear front-runner. The party polls around 25 per cent of the vote in Wallonia (see Table 3). The MR is second, with about 20 per cent of the vote, followed by Ecolo (16.6) and PTB (13.1). Given that there are important fluctuations in vote intentions between polls, the uncertainty of these estimates is quite large, and vote intentions for Ecolo and PTB can in fact not be distinguished statistically. Finally, cdH polls around 10.4 per cent of the vote at about a month before the election.
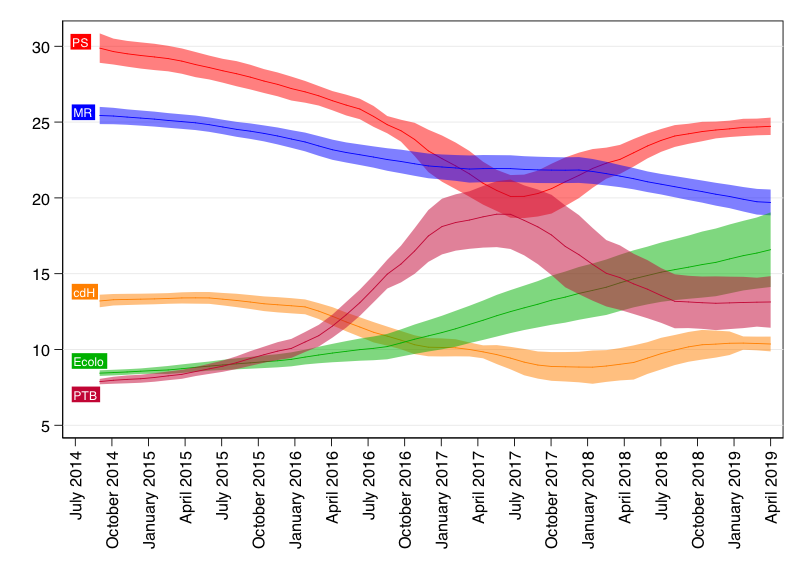
Table 3. Estimated vote intentions in Wallonia, 1 month before the May 26 election
| Party | Estimate | 95% CI |
| PS | 24.7 | (24.2 ; 25.3) |
| MR | 19.7 | (18.8 ; 20.6) |
| Ecolo | 16.6 | (14.1 ; 19.0) |
| PTB | 13.1 | (11.4 ; 14.8) |
| cdH | 10.4 | (9.9 ; 10.8) |
[1] This implies we exclude the extreme-left parties and also the extreme-right on the francophone side.
[2] More specifically, we estimate a kernel-weighted local polynomial regression, using the Epanechnikov kernel function. We do not specify a bandwith, but use the default rule-of-thumb bandwidth estimator in the lpoly-function in the statistical package Stata.
Ce contenu a été mis à jour le 5 mai 2019 à 8 h 46 min.
Commentaires