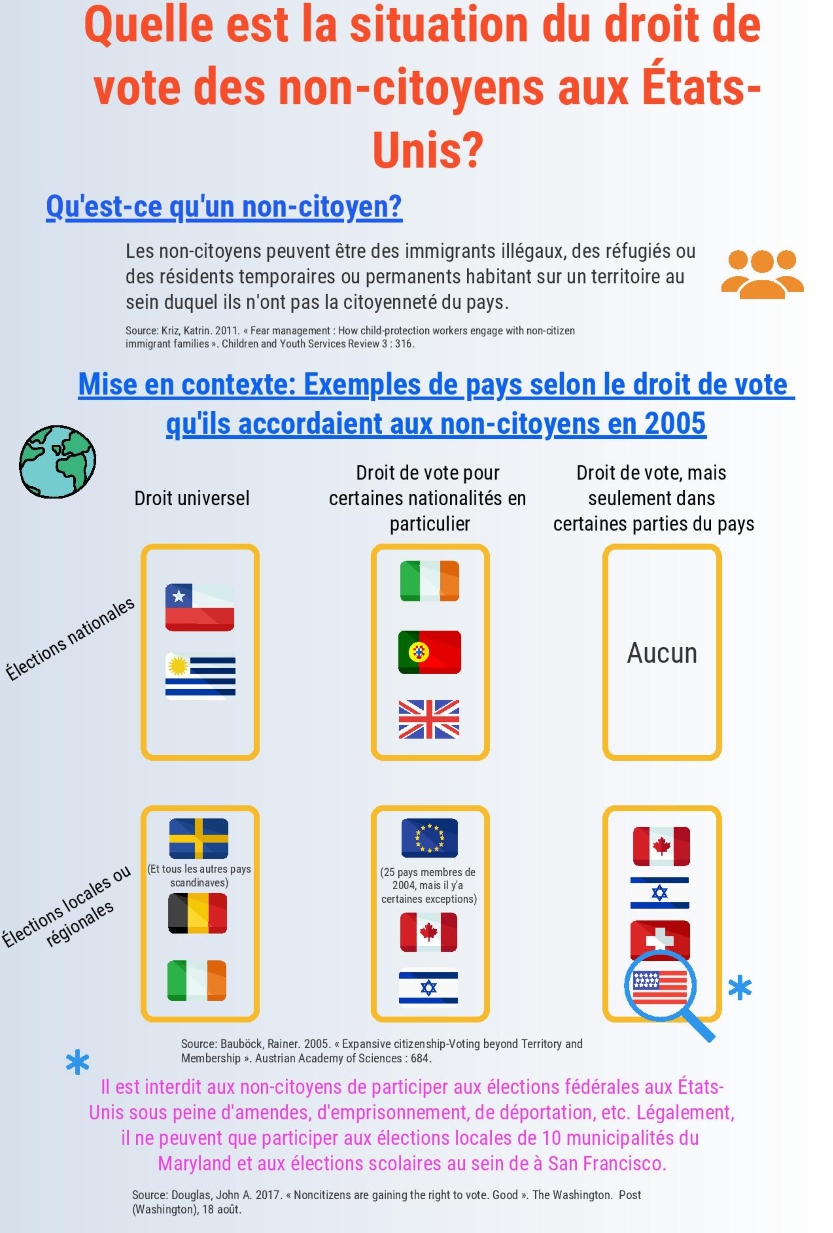
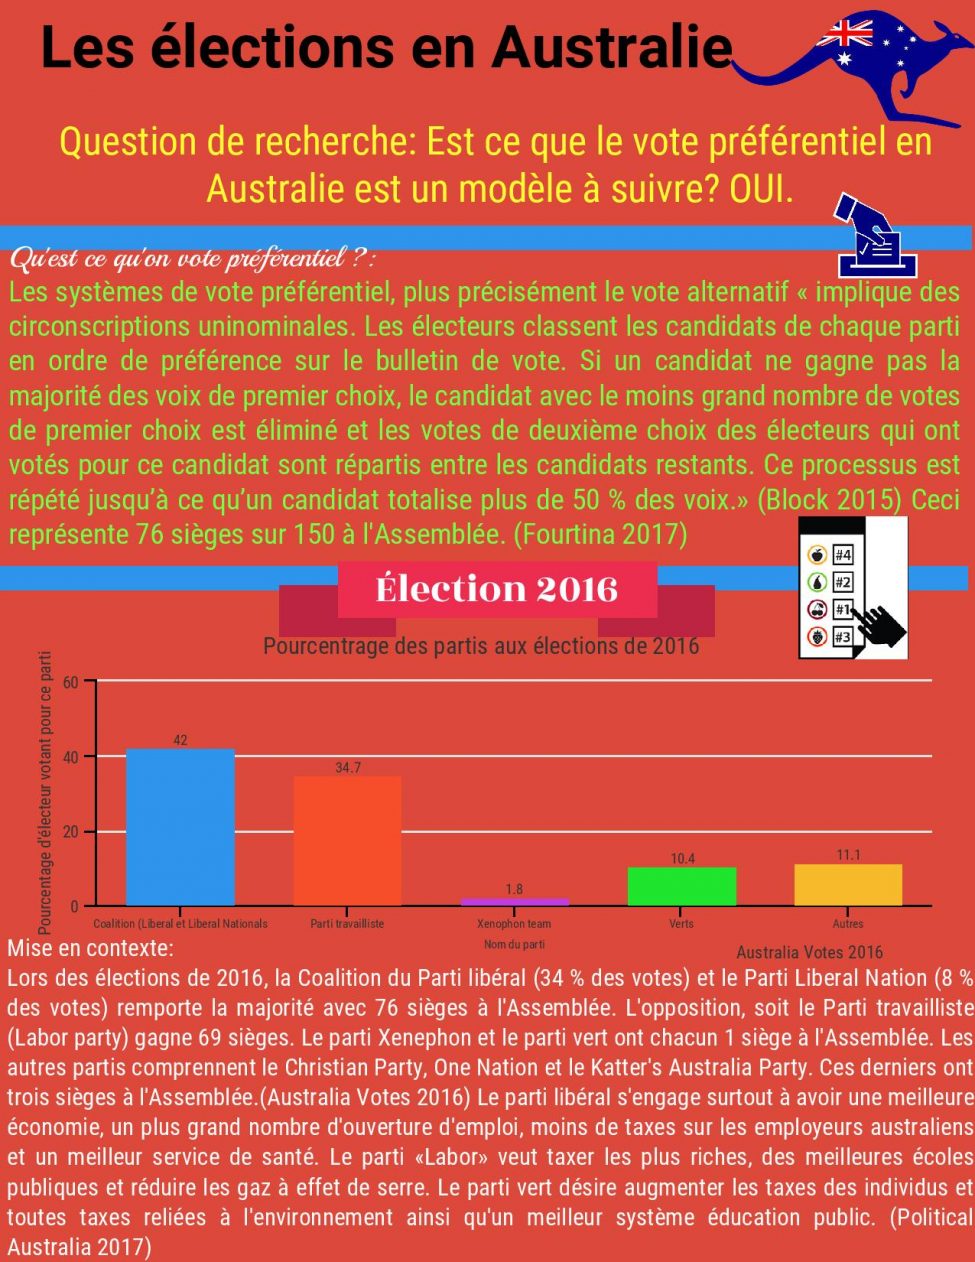
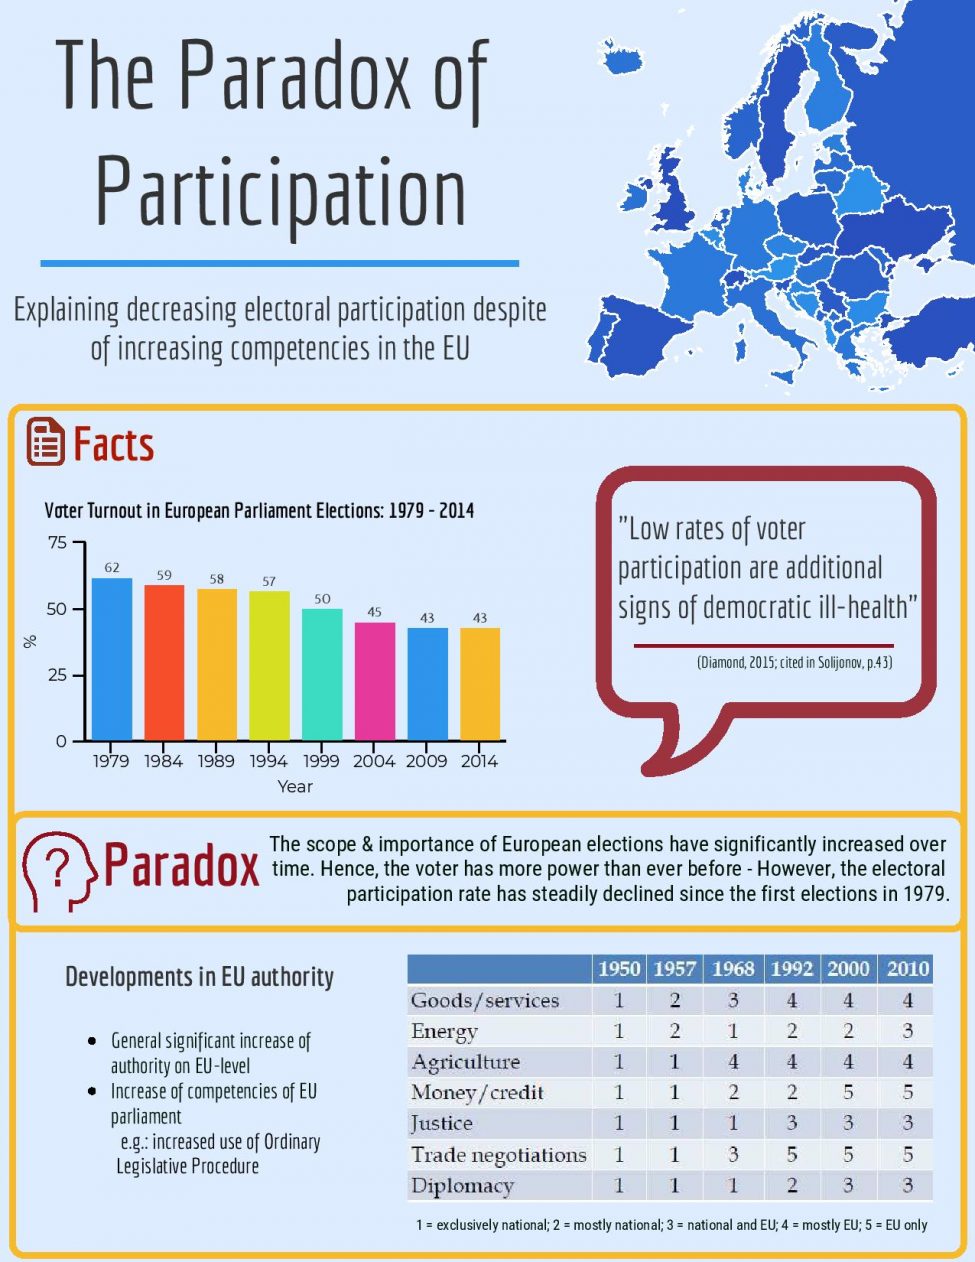
Infographics : POL3015 A18
Last term, I asked students enrolled in my undergrad course on elections (POL3015), to create infographics. In these infographics, they explained a concept in the field of electoral studies. The students created infographics on many different topics, such as the concept of economic voting, compulsory voting, women suffrage, amongst others.
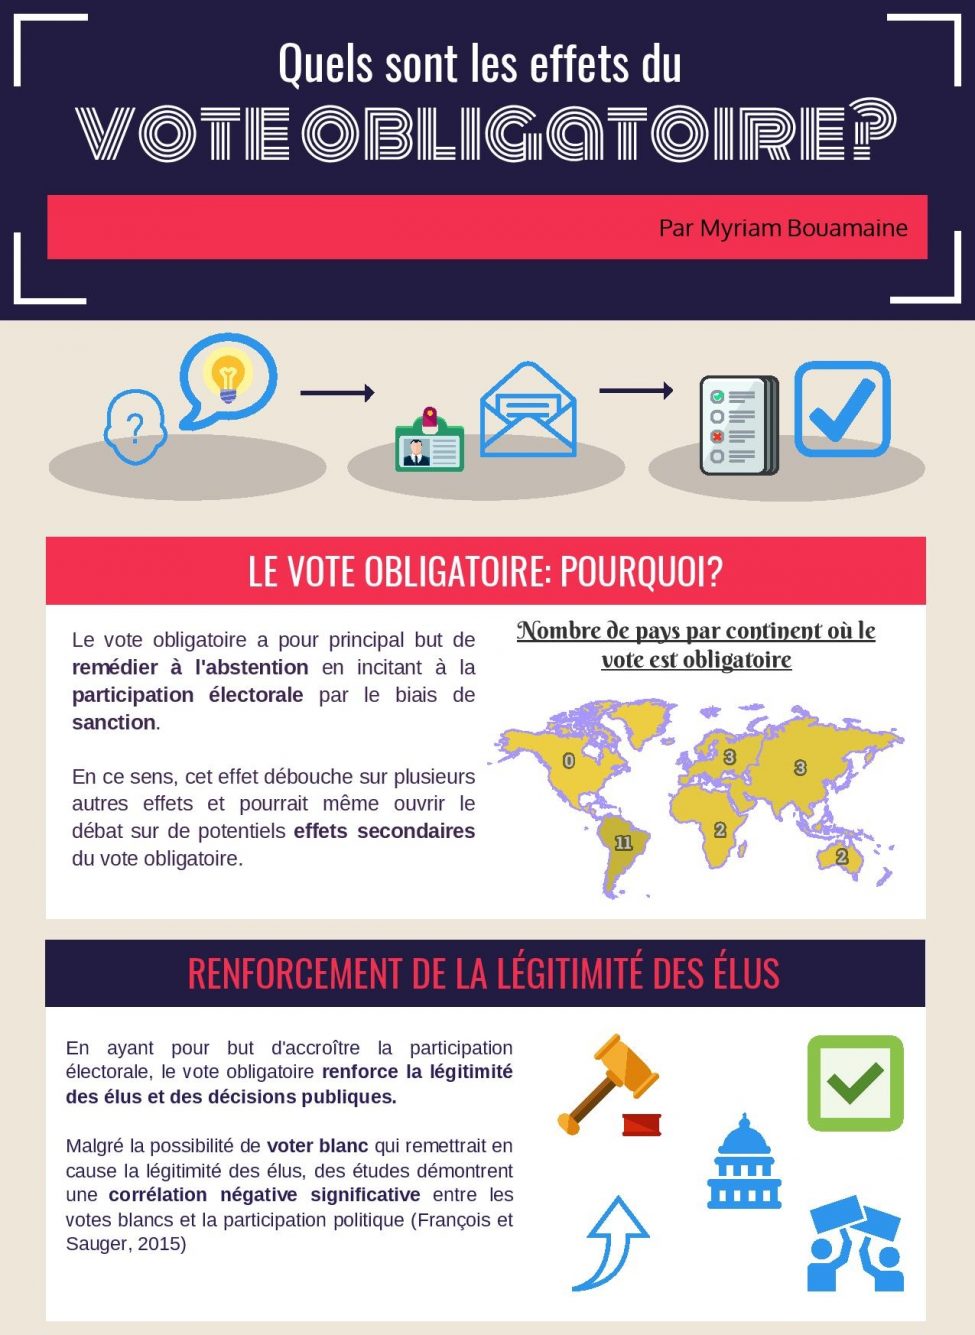
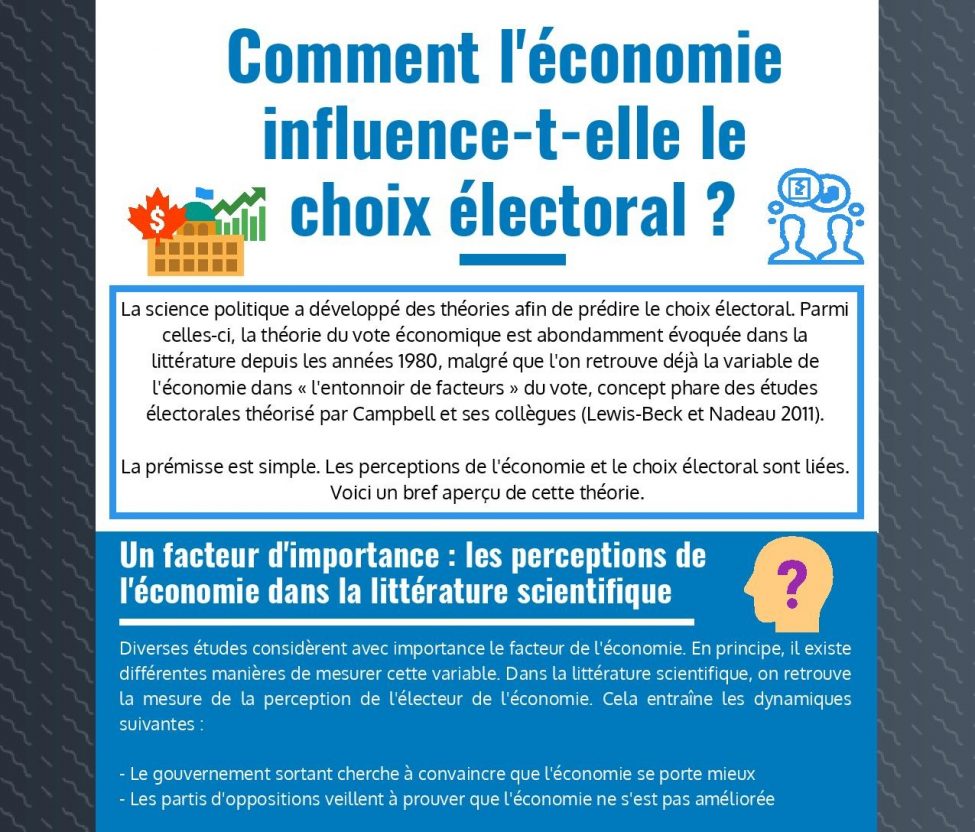
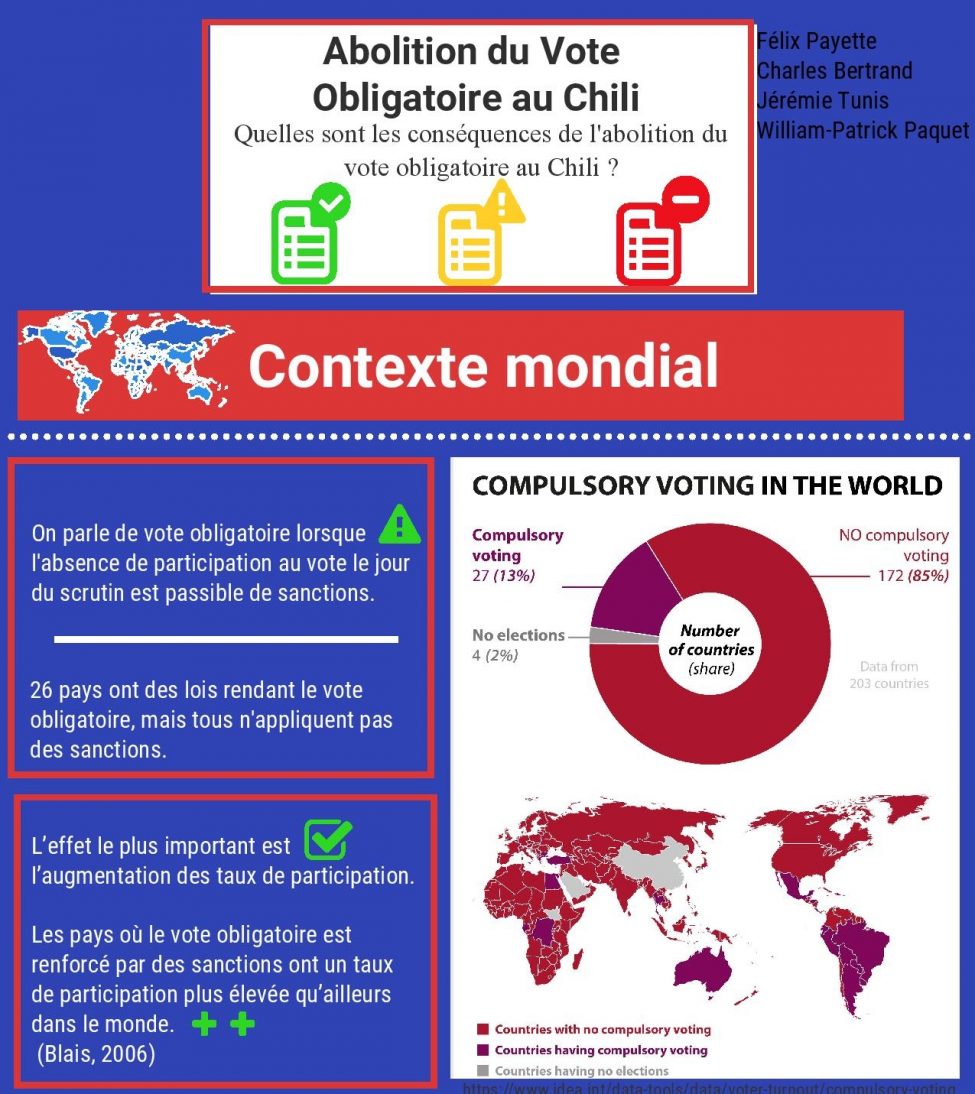
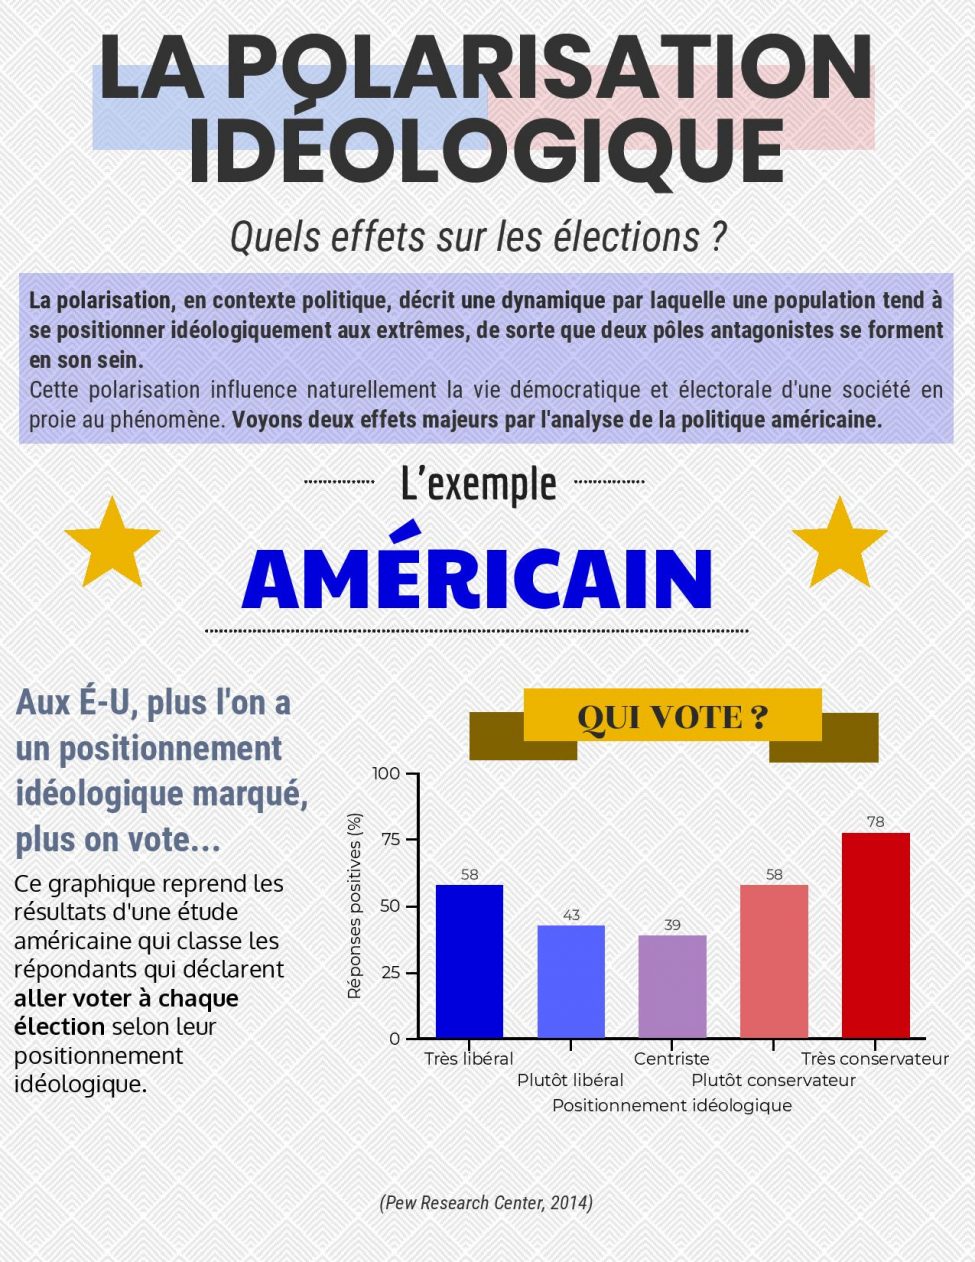
Below are some examples of the infographics that students created.

This content has been updated on 5 February 2019 at 15 h 29 min.
Comments